Venn Diagrams - Grade 10
(Question: 1622202772)


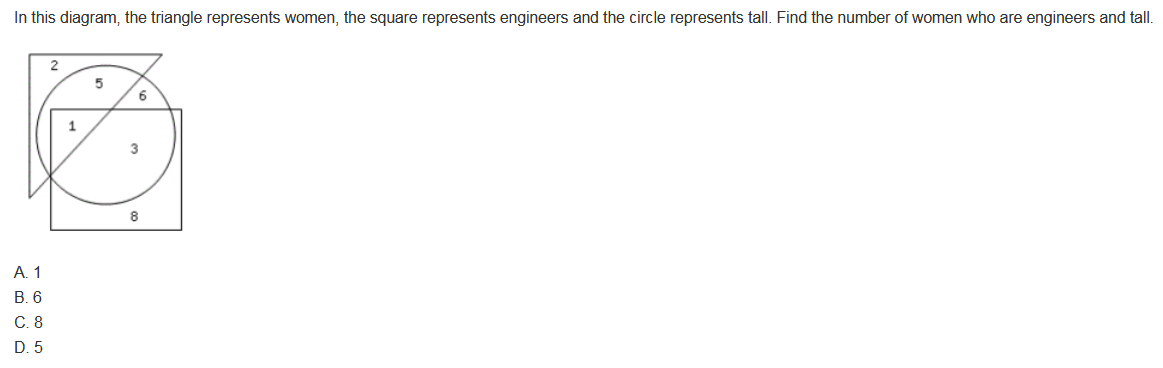
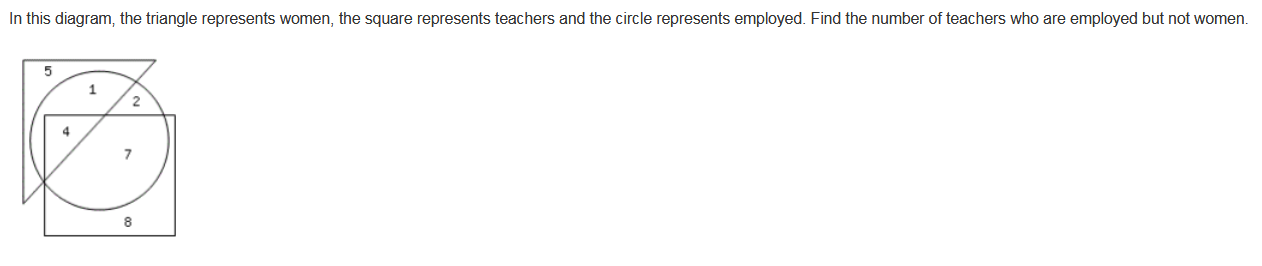
In this diagram, the triangle represents women, the square represents doctors and the circle represents employed. Find the number of women who are doctors and employed.
A. 5
B. 7
C. 8
D. 6

 1237 Likes 1162 Likes 394 Likes 1459 Likes 1122 Likes 1083 Likes 525 Likes 688 Likes No Likes No Likes
 Browse through all Practice Tests available for Grade 10
 Grade 10 Locked
 Chapter Wise
 ProbabilityGrade 10 Chapter WiseAlphabet ProblemsGrade 10 LockedChapter WiseMean, Mode and MedianGrade 10 LockedChapter WiseQuadratic EquationsGrade 10 LockedChapter WiseMean, Mode and MedianGrade 10 LockedChapter WiseVenn DiagramsGrade 10 LockedChapter WiseArea related to circlesGrade 10 LockedChapter WiseSurface Area and VolumeGrade 10 LockedChapter WiseVenn DiagramsGrade 10 LockedChapter WiseMean, Mode and Median
Browse through all worksheets available for Grade 10
Grade 10 LockedChapter WiseProbabilityGrade 10 LockedChapter WiseDice and CubesGrade 10 LockedChapter WiseTrianglesGrade 10 LockedChapter WiseTrigonometryGrade 10 LockedChapter WiseAlphabet ProblemsGrade 10 LockedChapter WiseTrianglesGrade 10 LockedChapter WiseReal NumbersGrade 10 LockedChapter WiseProbabilityGrade 10 LockedChapter WiseTrigonometry Watchlist
  Share
Share