Venn Diagrams - Grade 10
(Question: 1622204058)


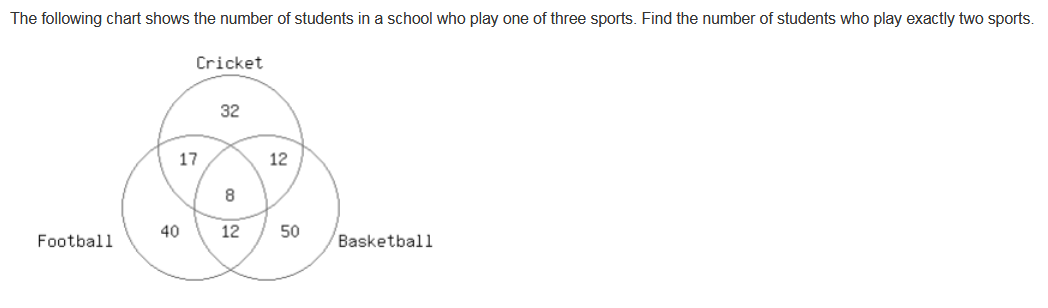
Following chart shows number of students in a school who got distinction in one of three subjects. Find the number of students who got distinction in at least two subjects.
A. 41
B. 37
C. 43
D. 45

 1237 Likes 394 Likes 1162 Likes 1122 Likes 767 Likes 1280 Likes 1459 Likes 429 Likes No Likes 800 Likes
 Browse through all Practice Tests available for Grade 10
 Grade 10 Locked
 Chapter Wise
 ProbabilityGrade 10 LockedChapter WiseAlphabet ProblemsGrade 10 LockedChapter WiseLinear Equations in Two VariablesGrade 10 LockedChapter WiseMean, Mode and MedianGrade 10 LockedChapter WiseReal NumbersGrade 10 LockedChapter WiseSurface Area and VolumeGrade 10 LockedChapter WiseNumber SeriesGrade 10 LockedChapter WiseDice and CubesGrade 10 LockedChapter WiseTrigonometryGrade 10 LockedChapter WiseArithmetic Progressions
Browse through all worksheets available for Grade 10
Grade 10 LockedChapter WiseVenn DiagramsGrade 10 LockedChapter WiseDice and CubesGrade 10 LockedChapter WiseProbabilityGrade 10 LockedChapter WiseDice and CubesGrade 10 LockedChapter WiseStatisticsGrade 10 LockedChapter WiseMean, Mode and MedianGrade 10 LockedChapter WiseVenn DiagramsGrade 10 Chapter WiseArithmetic Progressions Watchlist
  Share
Share